
Planar 5×7-bay grid with TWO X-braces stacked per bay
Part 5 of the unilateral-elements series. Same grid, same boundary conditions, same load as example 04 — but each 11 × 6 m bay is X-braced twice vertically: the 6 m Y-side is split in two at its midpoint, each 3 m half carries its own X of compression-only struts.
Important constraint: no horizontal tie is added at the midpoint row. The mid-node sits only on the two Y-truss halves and four diagonals, with no X-tie connection across the grid.
n_i(j+1) ──────────── tie ──────────── n_(i+1)(j+1) (top of bay) │ \ / │ │ \ upper-X (3 m) / │ │ \ / │ │ \ / │n_ijmid ── (NO tie) ── n_(i+1)jmid (midpoint of bay edges) │ / \ │ │ / \ │ │ / lower-X (3 m) \ │ │ / \ │n_ij ────────────── tie ────────────── n_(i+1)j (bottom of bay)Member inventory per bay
Section titled “Member inventory per bay”- 2 TieElement (top-of-bay + bottom-of-bay X-ties — unchanged)- 2 TrussElement (Y-side split: bottom-half + top-half, each 3 m)- 4 StrutElement (2 Xs × 2 diagonals each)Across the whole grid (35 bays): - TrussElement 84 (was 42 in example 04) - StrutElement 140 (was 70) - TieElement 40 (unchanged — still 40, no mid-row ties) - Nodes 90 (48 corner + 42 mid, up from 48)
Everything else matches example 04: four corner nodes pinned, all other
nodes (including the mid-nodes) are rollerXY (free in x, y; clamped
in z), and a −Y force is applied to every top-edge interior node.
Here the force is 100 kN per node, the members are heavier and all of
them are concrete (E = 30 GPa). A second plot gives the Y-shear each
diagonal brings into its connection to a Y-truss, for sizing those
connections.
Units: mm / N / MPa.
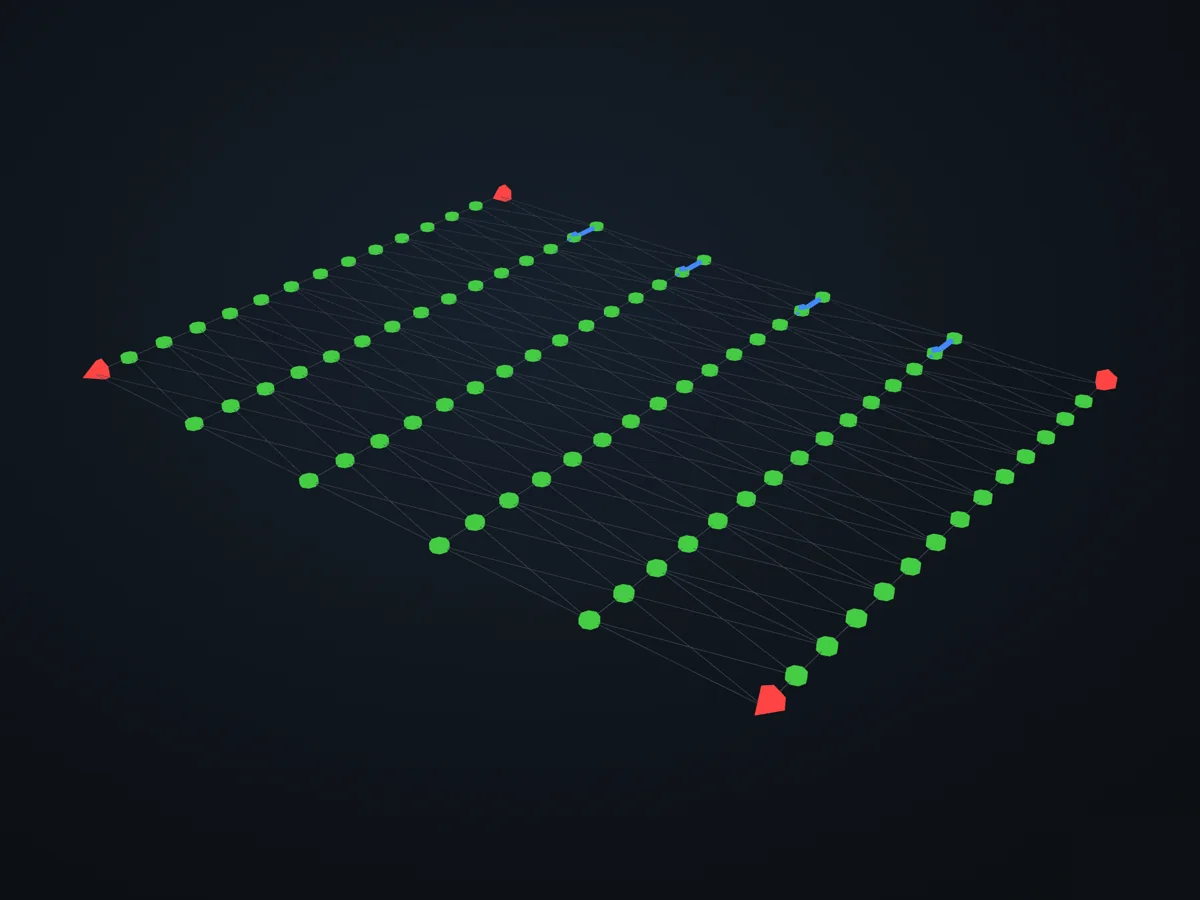
The model before it is solved: its parts, supports (red) and loads (blue).
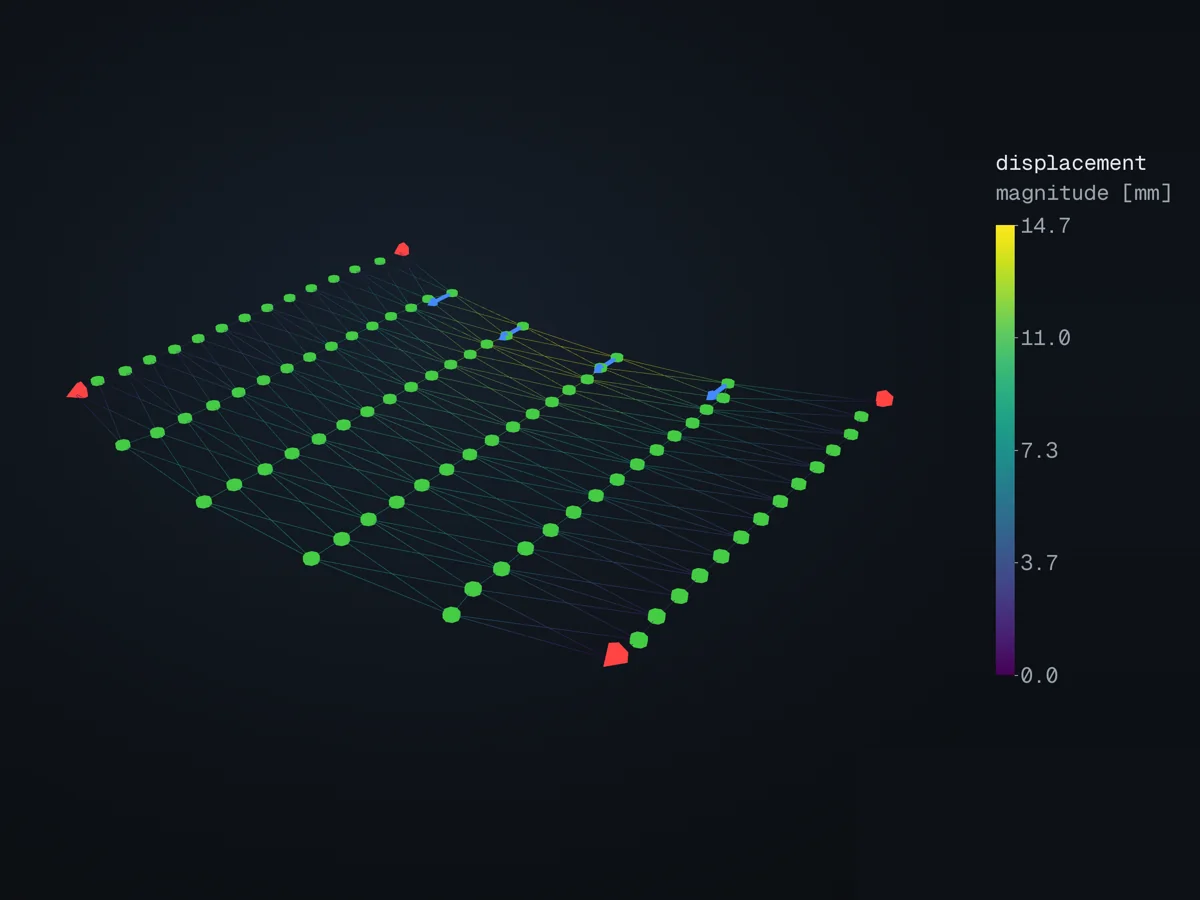
The deformed shape, coloured by displacement (magnitude [mm]), in xfea’s 3D viewer.
Open in 3D turn it, cut it, pick any field: in xfea's viewer, in your browser
The script
Section titled “The script”examples/scripts/02_core_concepts/unilateral_elements/05_grid_double_bracing.py. Run it from the repository with uv run python examples/scripts/02_core_concepts/unilateral_elements/05_grid_double_bracing.py, or, with xfea-examples installed, xfea-examples run 02_core_concepts/unilateral_elements/05_grid_double_bracing.py.
from __future__ import annotations
import mathfrom pathlib import Path
from xfea.model import (    ElasticIsotropic,    Model,    Node,    Part,    StrutElement,    StrutSection,    TieElement,    TieSection,    TrussElement,    TrussSection,)from xfea.problem import Problem, StaticStepfrom xfea.results import DisplacementFieldResults
from xfea_examples import out_dir

# Geometry / material / loadNX, NY = 5, 7                 # bays along X and YLX_BAY = 11_000.0             # [mm]LY_BAY = 6_000.0              # [mm]
A_TIE_X = 2463.0               # [mm²] slender rod along X (tension only)A_TRUSS_Y = 11550.0             # [mm²] bilateral column member along YA_STRUT_DIAG = 7500.0          # [mm²] compression-only diagonal brace
P_LOAD = -100_000.0            # [N] force per top-edge (non-corner) node in Y
concrete = ElasticIsotropic(E=30_000.0, v=0.2, density=0, name="concrete")

# Model builder with double X-bracingdef build_grid():    """5×7 bay grid with two X-braces per bay stacked along Y."""    model = Model(name="grid_double_bracing",                  description="5×7 bay grid, 2 Xs per bay")    part = model.add_part(Part(name="grid"))
    tie_x = TieSection(A=A_TIE_X, material=concrete)    truss_y = TrussSection(A=A_TRUSS_Y, material=concrete)    strut_diag = StrutSection(A=A_STRUT_DIAG, material=concrete)
    # ---- original grid nodes on a (NX+1)×(NY+1) lattice ----    nodes = [[None] * (NY + 1) for _ in range(NX + 1)]    for i in range(NX + 1):        for j in range(NY + 1):            nodes[i][j] = part.add_node(                Node(xyz=[i * LX_BAY, j * LY_BAY, 0.0])            )
    # ---- mid-nodes: one per vertical edge per bay (no mid-row ties) ----    # mid_nodes[i][j] sits at the midpoint of column i inside bay j    # (between nodes[i][j] and nodes[i][j+1]).    mid_nodes = [[None] * NY for _ in range(NX + 1)]    for i in range(NX + 1):        for j in range(NY):            mid_nodes[i][j] = part.add_node(                Node(xyz=[i * LX_BAY, (j + 0.5) * LY_BAY, 0.0])            )
    # ---- TieElement along X: ONLY at the original rows (unchanged) ----    for j in range(NY + 1):        for i in range(NX):            part.add_element(                TieElement(nodes=[nodes[i][j], nodes[i + 1][j]], section=tie_x)            )
    # ---- Y-trusses split in two at the mid-node ----    for i in range(NX + 1):        for j in range(NY):            part.add_element(                TrussElement(                    nodes=[nodes[i][j], mid_nodes[i][j]], section=truss_y                )            )            part.add_element(                TrussElement(                    nodes=[mid_nodes[i][j], nodes[i][j + 1]], section=truss_y                )            )
    # ---- Two Xs per bay: 4 compression-only diagonals ----    for i in range(NX):        for j in range(NY):            # Lower X (row j ↔ mid)            part.add_element(                StrutElement(                    nodes=[nodes[i][j], mid_nodes[i + 1][j]],                    section=strut_diag,                )            )            part.add_element(                StrutElement(                    nodes=[nodes[i + 1][j], mid_nodes[i][j]],                    section=strut_diag,                )            )            # Upper X (mid ↔ row j+1)            part.add_element(                StrutElement(                    nodes=[mid_nodes[i][j], nodes[i + 1][j + 1]],                    section=strut_diag,                )            )            part.add_element(                StrutElement(                    nodes=[mid_nodes[i + 1][j], nodes[i][j + 1]],                    section=strut_diag,                )            )
    # ---- Boundary conditions ----    corners = [nodes[0][0], nodes[NX][0], nodes[0][NY], nodes[NX][NY]]    model.add_pin_bc(nodes=corners)    all_original = [nodes[i][j] for i in range(NX + 1) for j in range(NY + 1)]    all_mid = [mid_nodes[i][j] for i in range(NX + 1) for j in range(NY)]    others = [n for n in (all_original + all_mid) if n not in corners]    model.add_rollerXY_bc(nodes=others)
    top_edge_loaded = [nodes[i][NY] for i in range(1, NX)]    return model, nodes, mid_nodes, top_edge_loaded

# Axial force helpersdef _axis(n1: Node, n2: Node) -> tuple[float, float, float]:    dx = float(n2.x) - float(n1.x)    dy = float(n2.y) - float(n1.y)    dz = float(n2.z) - float(n1.z)    mag = math.sqrt(dx * dx + dy * dy + dz * dz)    return (dx / mag, dy / mag, dz / mag)

def _elongation(element, disp_field, time) -> float:    n1, n2 = element.nodes    u1 = disp_field.get_result_at(n1, time=time)    u2 = disp_field.get_result_at(n2, time=time)    du = (        float(u2.x) - float(u1.x),        float(u2.y) - float(u1.y),        float(u2.z) - float(u1.z),    )    ax, ay, az = _axis(n1, n2)    return du[0] * ax + du[1] * ay + du[2] * az

def _axial_mode(element) -> str:    if isinstance(element, StrutElement):        return "strut"    if isinstance(element, TieElement):        return "tie"    return "bilateral"

def _axial_force(element, disp_field, time) -> float:    L_el = float(element.length)    if L_el <= 0.0:        return 0.0    K = float(element.section.material.E) * float(element.section.A) / L_el    try:        delta = _elongation(element, disp_field, time)    except (TypeError, AttributeError):        return 0.0    if not math.isfinite(delta):        return 0.0    mode = _axial_mode(element)    if mode == "tie":        return K * delta if delta > 0 else 0.0    if mode == "strut":        return K * delta if delta < 0 else 0.0    return K * delta

def _classify(element) -> str:    if isinstance(element, StrutElement):        return "strut"    if isinstance(element, TieElement):        return "tie"    return "truss"

# Matplotlib plot of axial forcesdef plot_axial_forces(    elements,    axial: dict,    corner_nodes,    loaded_nodes,    save_to=None,    show: bool = True,    slack_threshold: float = 1.0,    min_lw: float = 0.6,    max_lw: float = 4.0,):    """Plan view with one coloured line per element.
    Colours:        tab:red   — tension (N > slack_threshold)        tab:blue  — compression (N < -slack_threshold)        lightgray — |N| ≤ slack_threshold (slack)    Line width scales linearly with |N|.  Non-slack values are    annotated (kN) at the element midpoint.    """    import matplotlib.lines as mlines    import matplotlib.pyplot as plt
    fig, ax = plt.subplots(figsize=(12, 9))
    max_abs_N = max((abs(N) for N in axial.values()), default=1.0) or 1.0
    labels = []    for el in sorted(elements, key=lambda e: abs(axial.get(e, 0.0))):        N = axial.get(el, 0.0)        n1, n2 = el.nodes        x0, y0 = float(n1.x), float(n1.y)        x1, y1 = float(n2.x), float(n2.y)        if abs(N) <= slack_threshold:            color, lw, z = "lightgray", min_lw, 1        elif N < 0.0:            color = "tab:blue"            lw = min_lw + (max_lw - min_lw) * (abs(N) / max_abs_N)            z = 2        else:            color = "tab:red"            lw = min_lw + (max_lw - min_lw) * (abs(N) / max_abs_N)            z = 2        ax.plot([x0, x1], [y0, y1], color=color, linewidth=lw,                solid_capstyle="round", zorder=z)
        if abs(N) > slack_threshold:            mx = 0.5 * (x0 + x1)            my = 0.5 * (y0 + y1)            angle = math.degrees(math.atan2(y1 - y0, x1 - x0))            if angle > 90:                angle -= 180            if angle < -90:                angle += 180            labels.append((mx, my, N, color, angle))
    for mx, my, N, color, angle in labels:        text = f"{N / 1000:+.2f} kN"        ax.text(            mx, my, text,            rotation=angle, rotation_mode="anchor",            ha="center", va="center",            fontsize=6, color=color, fontweight="semibold",            bbox=dict(facecolor="white", edgecolor="none",                      alpha=0.85, pad=0.5, boxstyle="round,pad=0.2"),            zorder=10,        )
    all_nodes = {n for el in elements for n in el.nodes}    ax.scatter(        [float(n.x) for n in all_nodes],        [float(n.y) for n in all_nodes],        s=14, color="black", zorder=5,    )    ax.scatter(        [float(n.x) for n in corner_nodes],        [float(n.y) for n in corner_nodes],        s=120, facecolor="black", marker="s", zorder=6,    )
    if loaded_nodes:        arrow_len = 0.6 * LY_BAY        dy = -arrow_len if P_LOAD < 0 else +arrow_len        for n in loaded_nodes:            ax.annotate(                "",                xy=(float(n.x), float(n.y) + dy),                xytext=(float(n.x), float(n.y)),                arrowprops=dict(arrowstyle="-|>", color="black", lw=1.8,                                shrinkA=0, shrinkB=0),                zorder=7,            )
    compr = mlines.Line2D([], [], color="tab:blue", lw=3, label="compression")    tens = mlines.Line2D([], [], color="tab:red", lw=3, label="tension")    slack = mlines.Line2D([], [], color="lightgray", lw=1.2, label="slack")    pin = mlines.Line2D([], [], color="black", marker="s", linestyle="None",                        markersize=9, label="pinned corner")    ax.legend(handles=[compr, tens, slack, pin], loc="upper right",              framealpha=0.9)
    ax.set_aspect("equal")    ax.set_xlabel("X (mm)")    ax.set_ylabel("Y (mm)")    ax.set_title(        f"Grid axial forces — 2 Xs per bay\n"        f"P_load = {P_LOAD:+.0f} N/node on top edge  |  "        f"max |N| = {max_abs_N:,.0f} N"    )    ax.grid(True, alpha=0.25, linestyle=":")    ax.margins(0.05)
    fig.tight_layout()    if save_to is not None:        fig.savefig(save_to, dpi=150)        print(f"  axial-force plot saved: {save_to}")    if show:        print("  (close the matplotlib window to continue)")        plt.show()    else:        plt.close(fig)

# Matplotlib plot of diagonal-induced Y-shear at each hingedef plot_diagonal_y_shear(    elements,    axial: dict,    corner_nodes,    loaded_nodes,    save_to=None,    show: bool = True,    zero_threshold: float = 1.0,):    """Scatter of every node coloured by the Y-shear demand the bracing    panels impose on the connection at that hinge.
    Use case: the diagonals represent structural panels that have to be    anchored to the Y-trusses.  Each panel has its own connection at    each end, and the connection has to transmit the full axial force    of the panel — resolved onto the Y-axis to get the vertical shear    demand.  For sizing purposes the critical number at each hinge is    therefore the *max* |N·cos θy| over the diagonals attached there,    not the signed sum (which can partially cancel if two panels push    in opposite Y directions).
    Plot encodes:        - marker size: critical |Y-shear| magnitude at the hinge        - marker colour: sign of the critical Y-shear (+ = up, − = down)        - annotation: value in kN (only where |critical| > threshold)    """    import matplotlib.lines as mlines    import matplotlib.pyplot as plt    from matplotlib.colors import TwoSlopeNorm
    # For each hinge, collect every diagonal's signed Y-shear    # contribution and keep the one with the largest magnitude.    contribs: dict = {}     # node -> list of signed Y-shear values    for el in elements:        if not isinstance(el, StrutElement):            continue        N = axial.get(el, 0.0)        if abs(N) < 1e-12:            continue        L_el = float(el.length)        n1, n2 = el.nodes        y1, y2 = float(n1.y), float(n2.y)        # Force on n1 from this panel: N × (n2 − n1)/L — Y-component:        uy_12 = (y2 - y1) / L_el        s1 = N * uy_12        s2 = -s1        contribs.setdefault(n1, []).append(s1)        contribs.setdefault(n2, []).append(s2)
    shear: dict = {}    for node, vals in contribs.items():        # Critical (max magnitude, signed).        shear[node] = max(vals, key=abs)
    # Collect every node touched by the grid (so lonely ones still appear    # as 0-valued dots on the backdrop).    all_nodes = {n for el in elements for n in el.nodes}    for n in all_nodes:        shear.setdefault(n, 0.0)
    max_abs = max((abs(s) for s in shear.values()), default=1.0) or 1.0
    fig, ax = plt.subplots(figsize=(12, 9))
    # Backdrop: grid geometry in light gray so the scatter has context.    for el in elements:        n1, n2 = el.nodes        ax.plot(            [float(n1.x), float(n2.x)],            [float(n1.y), float(n2.y)],            color="lightgray", linewidth=0.6, zorder=1,        )
    norm = TwoSlopeNorm(vmin=-max_abs, vcenter=0.0, vmax=+max_abs)    xs, ys, cs, sizes = [], [], [], []    for n, s in shear.items():        xs.append(float(n.x))        ys.append(float(n.y))        cs.append(s)        # Minimum 20 px² so the 0-valued hinges are still visible.        sizes.append(20 + 240 * (abs(s) / max_abs))    sc = ax.scatter(        xs, ys, c=cs, s=sizes, cmap="RdBu_r", norm=norm,        edgecolors="black", linewidths=0.4, zorder=4,    )
    # Pinned corners on top, as black squares (larger).    ax.scatter(        [float(n.x) for n in corner_nodes],        [float(n.y) for n in corner_nodes],        s=160, facecolor="none", edgecolor="black",        linewidths=1.6, marker="s", zorder=6,    )
    # Annotate non-zero values (kN) at each hinge; skip the ones that are    # essentially zero to keep the plot clean.    for n, s in shear.items():        if abs(s) <= zero_threshold:            continue        ax.annotate(            f"{s / 1000:+.2f} kN",            xy=(float(n.x), float(n.y)),            xytext=(6, 4), textcoords="offset points",            fontsize=6, color="black", fontweight="semibold",            bbox=dict(facecolor="white", edgecolor="none",                      alpha=0.85, pad=0.5, boxstyle="round,pad=0.2"),            zorder=7,        )
    # Load arrows (same style as the axial-force plot).    if loaded_nodes:        arrow_len = 0.6 * LY_BAY        dy = -arrow_len if P_LOAD < 0 else +arrow_len        for n in loaded_nodes:            ax.annotate(                "",                xy=(float(n.x), float(n.y) + dy),                xytext=(float(n.x), float(n.y)),                arrowprops=dict(arrowstyle="-|>", color="black", lw=1.8,                                shrinkA=0, shrinkB=0),                zorder=3,            )
    cbar = fig.colorbar(sc, ax=ax, shrink=0.75)    cbar.set_label(        "Critical Y-shear per bracing connection (N)\n(+ up / − down)"    )
    # Legend — pinned corner + scatter    pin = mlines.Line2D([], [], color="black", marker="s",                        linestyle="None", markerfacecolor="none",                        markersize=10, label="pinned corner")    ax.legend(handles=[pin], loc="upper right", framealpha=0.9)
    ax.set_aspect("equal")    ax.set_xlabel("X (mm)")    ax.set_ylabel("Y (mm)")    ax.set_title(        f"Y-shear demand at each bracing-to-Y-truss connection\n"        f"(max |N·cos θy| across panels at each hinge — "        f"max overall = {max_abs:,.0f} N)"    )    ax.grid(True, alpha=0.25, linestyle=":")    ax.margins(0.05)
    fig.tight_layout()    if save_to is not None:        fig.savefig(save_to, dpi=150)        print(f"  diagonal-Y-shear plot saved: {save_to}")    if show:        print("  (close the matplotlib window to continue)")        plt.show()    else:        plt.close(fig)

# Maindef main() -> None:    model, grid, mid_grid, loaded_nodes = build_grid()    elements = list(model.parts[0].elements)
    counts = {"truss": 0, "tie": 0, "strut": 0}    for el in elements:        counts[_classify(el)] += 1    total_nodes = sum(1 for _ in model.parts[0].nodes)    print(f"Grid built: {total_nodes} nodes, {len(elements)} elements")    print(f"  TieElement   (X, tension-only)       : {counts['tie']}")    print(f"  TrussElement (Y, bilateral, split)   : {counts['truss']}")    print(f"  StrutElement (2 Xs / bay)            : {counts['strut']}")    print(f"Loaded nodes (top edge, Y = {P_LOAD:+.0f} N each) : {len(loaded_nodes)}")    print()
    # With 2 Xs per bay the problem is more nonlinear than example 04    # (more diagonals cross between active/slack branches during    # iteration).  nlgeom=False keeps the tangent matrix well-    # conditioned since displacements are in the mm range on a metres-    # scale grid; the unilateral members are still solved iteratively.    problem = model.add_problem(Problem(name="grid_run"))    step = problem.add_step(        StaticStep(            name="pull_top",            nlgeom=False,            initial_inc_size=0.1,            max_inc_size=0.5,            min_inc_size=1e-4,            max_increments=200,        )    )    step.add_uniform_forcefield(        nodes=loaded_nodes, y=P_LOAD, load_case="pull_top"    )
    disp = DisplacementFieldResults()    step.add_field_outputs([disp])
    out = Path(out_dir(model.name))    problem.analyse_and_extract(path=out, verbose=True)
    STEP_END = 1.0    axial = {el: _axial_force(el, disp, STEP_END) for el in elements}
    print()    print("=" * 70)    print("Results at step end (t = 1.0):")    max_uy = disp.get_max_result("y")    min_uy = disp.get_min_result("y")    print(f"  max u_y = {float(max_uy.y):+.3f} mm   (node {max_uy.location.key})")    print(f"  min u_y = {float(min_uy.y):+.3f} mm   (node {min_uy.location.key})")
    print()    print("Axial force summary (sign: + tension, − compression):")    for kind in ("truss", "tie", "strut"):        forces = [N for el, N in axial.items() if _classify(el) == kind]        if not forces:            continue        peak_t = max(forces)        peak_c = min(forces)        slack = sum(1 for N in forces if abs(N) < 1.0)        print(            f"  {kind:<6} ({len(forces):>3} elements) : "            f"N_max = {peak_t:+9.1f} N, N_min = {peak_c:+9.1f} N, "            f"slack ≈ {slack}"        )
    sorted_by_N = sorted(axial.items(), key=lambda kv: kv[1])    print()    print("Top 5 most-compressed members:")    for el, N in sorted_by_N[:5]:        n1, n2 = el.nodes        print(            f"  {_classify(el):<6} elem {el.key:>3} : "            f"N = {N:+9.1f} N   "            f"({float(n1.x) / 1000:.1f},{float(n1.y) / 1000:.1f} → "            f"{float(n2.x) / 1000:.1f},{float(n2.y) / 1000:.1f}) m"        )    print("Top 5 most-tensioned members:")    for el, N in sorted_by_N[-5:][::-1]:        n1, n2 = el.nodes        print(            f"  {_classify(el):<6} elem {el.key:>3} : "            f"N = {N:+9.1f} N   "            f"({float(n1.x) / 1000:.1f},{float(n1.y) / 1000:.1f} → "            f"{float(n2.x) / 1000:.1f},{float(n2.y) / 1000:.1f}) m"        )    print("=" * 70)
    corners_list = [grid[0][0], grid[NX][0], grid[0][NY], grid[NX][NY]]
    png_path = out / "axial_forces.png"    try:        plot_axial_forces(            elements,            axial,            corner_nodes=corners_list,            loaded_nodes=loaded_nodes,            save_to=png_path,            show=True,        )    except Exception as exc:  # pragma: no cover        print(f"  plot skipped ({type(exc).__name__}: {exc})")
    shear_png = out / "diagonal_y_shear.png"    try:        plot_diagonal_y_shear(            elements,            axial,            corner_nodes=corners_list,            loaded_nodes=loaded_nodes,            save_to=shear_png,            show=True,        )    except Exception as exc:  # pragma: no cover        print(f"  plot skipped ({type(exc).__name__}: {exc})")
if __name__ == "__main__": main()© 2026 Francesco Ranaudo · Text and pictures CC BY 4.0 · Code Elastic License 2.0 · how to reuse them